Code your indicators.
Run them on the chart.
Write indicators and strategies in TypeScript, or import your Pine Script. They draw on the same chart you trade from, and strategies run in the Backtest tab. All in your browser, with nothing to install.
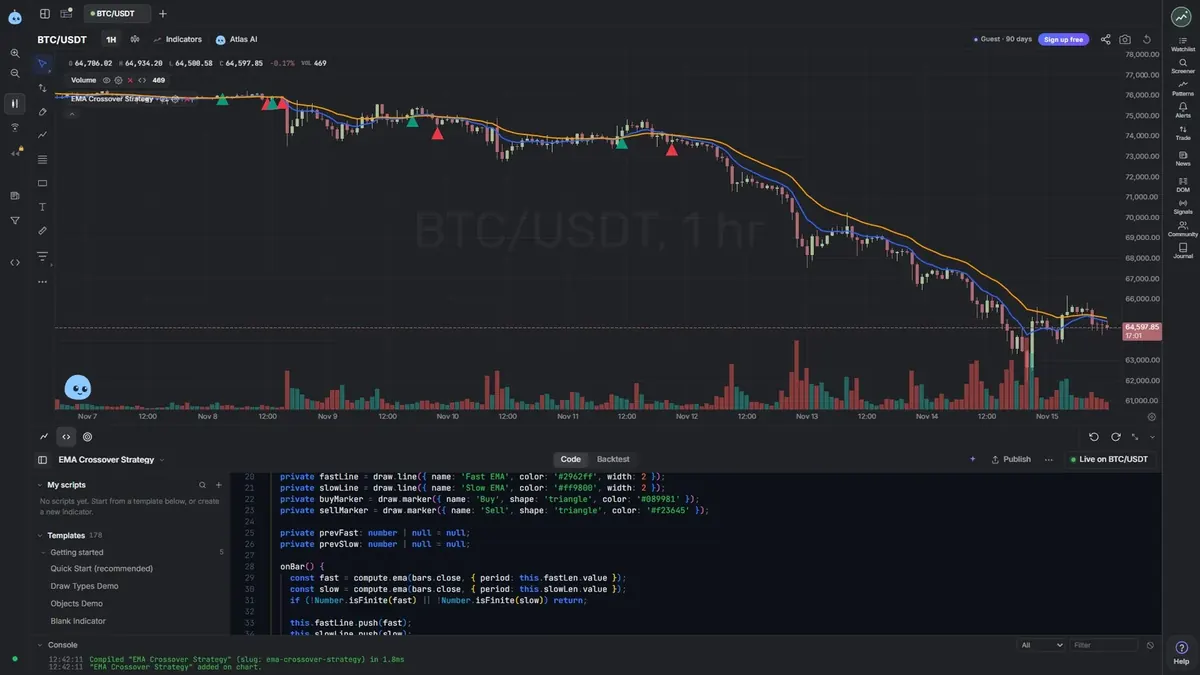
Pine v5 and v6 to TypeScript
Compiled and added to the chart
Write it like Pine.
Typed like TypeScript.
One file can plot lines, mark signals and place backtest orders. The body runs once per bar, the same mental model you already know.
- 1Autocomplete for every SDK name
- 2Inputs show up in the indicator settings
- 3Orders fill at the next bar’s open
import { indicator, ta, plot, plotShape, strategy, close } from '@chartlabs/script-sdk';

export default indicator('Golden Cross', { placement: 'overlay' }, () => {
  const fast = ta.ema(close, 50);
  const slow = ta.ema(close, 200);
  plot(fast, { title: 'EMA 50', color: '#2962ff' });
  plot(slow, { title: 'EMA 200', color: '#ff9800' });
  plotShape(ta.crossover(fast, slow), { title: 'Buy', shape: 'triangleup', location: 'below', color: '#089981' });
  if (ta.crossover(fast, slow).value) strategy.entry('long', 'long');
  if (ta.crossunder(fast, slow).value) strategy.close('death cross');
});Import Pine ScriptBring your Pine. Paste, convert, run.
Open CodeLab, choose Import from Pine Script, paste your source and press Convert. The importer lists anything it could not translate, so you know what to check.
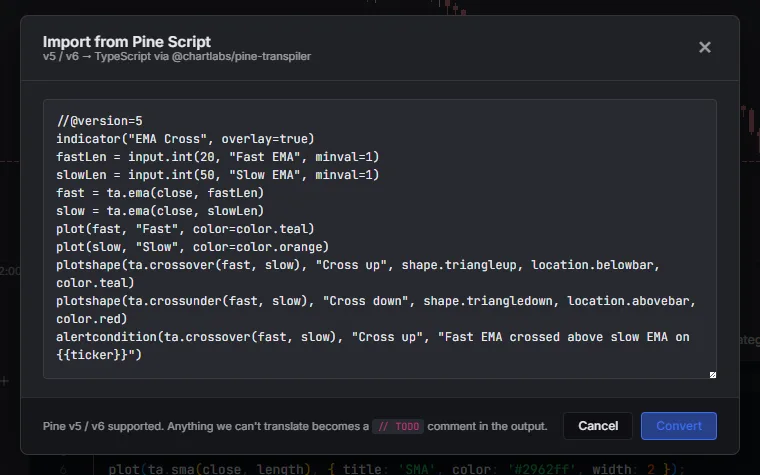
Paste your Pine
Pine Script v5 and v6. Public libraries in import lines are fetched for you.
Anything the importer cannot translate becomes a // TODO comment in the output. The notes are also saved at the top of the code.
Read the notes
A clean conversion opens in the editor at once. With warnings, the dialog stays open so you can read them first.
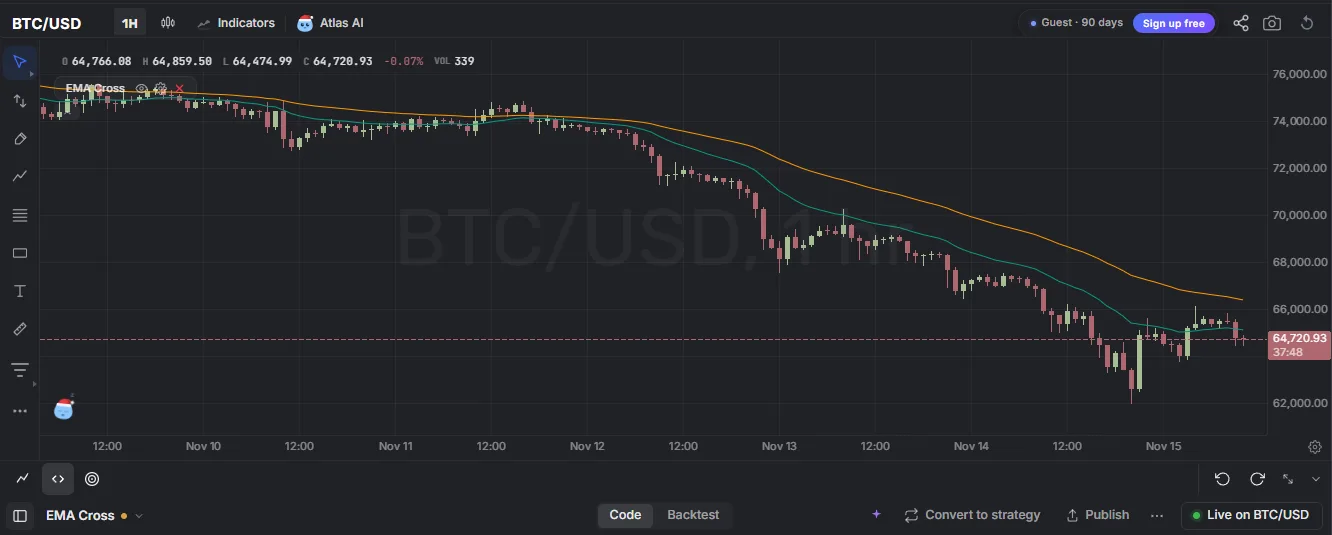
Add to chart
Press Add to chart and it runs on the chart you have open. Strategies keep their orders for the Backtest tab.
Compare a converted script with the original before you rely on it. Read the step by step guide
Why CodeLabA real language on a real chart.
TypeScript, not a toy language
Real TypeScript in a full code editor, with autocomplete for every SDK name and errors inline as you type.
A full ta.* library
Moving averages, RSI, MACD, ATR, Bollinger Bands, VWAP, SuperTrend, pivots and more. Series in, Series out, so they compose.
Runs in a worker
Every script runs in its own worker thread, so a slow or broken script never freezes the chart.
AI help in the editor
Ask the AI to generate, explain, debug or change a script, or just chat about it. Billed in AI credits.
Backtest tab
strategy.entry, exit and close place orders. They fill at the next bar’s open, so a signal never trades on a price it could not know.
Draws on the real chart
Plots, markers, labels, lines, boxes and tables render on the same chart you trade from. No separate window.
ExamplesFour scripts, one SDK.
import { indicator, input, ta, plot, hline, plotShape, strategy, close } from '@chartlabs/script-sdk';

export default indicator('RSI Mean Reversion', { placement: 'subpane' }, () => {
  const length = input.int('RSI length', 14, { min: 2, max: 100 });
  const oversold = input.float('Oversold', 30, { min: 5, max: 50 });
  const overbought = input.float('Overbought', 70, { min: 50, max: 95 });

  const rsi = ta.rsi(close, length);
  plot(rsi, { title: 'RSI', color: '#7e57c2', width: 2 });
  hline(oversold, { title: 'Oversold', color: '#089981', style: 'dashed' });
  hline(overbought, { title: 'Overbought', color: '#f23645', style: 'dashed' });

  const longEntry = ta.crossover(rsi, oversold);
  const longExit = ta.crossunder(rsi, overbought);
  plotShape(longEntry, { title: 'Entry', shape: 'triangleup', location: 'absolute', price: rsi, color: '#089981' });

  // Orders fill at the next bar's open in the Backtest tab.
  if (longEntry.value) strategy.entry('rsi', 'long');
  if (longExit.value) strategy.close('rsi overbought');
});
Learn the languageYour first indicator, in four steps.
No class and no boilerplate. Each step is a working snippet.
Your first indicator
A complete indicator: a moving-average cross with buy and sell markers. No class and no boilerplate. You write a body and it renders.
import { indicator, ta, plot, plotShape, close } from '@chartlabs/script-sdk';

export default indicator('EMA Cross', { placement: 'overlay' }, () => {
  const fast = ta.ema(close, 12);
  const slow = ta.ema(close, 26);
  plot(fast, { title: 'Fast EMA', color: '#2b8aef' });
  plot(slow, { title: 'Slow EMA', color: '#ef5350' });
  plotShape(ta.crossover(fast, slow),  { title: 'Buy',  shape: 'triangleup',   location: 'below', color: '#26a69a' });
  plotShape(ta.crossunder(fast, slow), { title: 'Sell', shape: 'triangledown', location: 'above', color: '#ef5350' });
});Inputs
input.* adds a setting to the indicator dialog and returns its current value. Use it inline.
const fastLen = input.int('Fast', 12, { min: 1, max: 200 });
const slowLen = input.int('Slow', 26, { min: 1, max: 400 });
plot(ta.ema(close, fastLen), { title: 'Fast EMA' });

// Also: input.float, input.bool, input.string, input.color,
// input.source, input.timeframeSeries and ta.*
A Series is a value per bar with its history, indexed newest first. JavaScript has no operator overloading, so Series math uses chainable methods.
close[0]                     // this bar's close
close[1]                     // the bar before
ta.ema(close, 20)            // a Series with full history
close.sub(open)              // close - open, bar by bar
close.gt(open).iff(1, -1) // per-bar ternaryPlots and drawings
The plot family runs at the top level. Labels, lines, boxes and tables can be called as often as you like.
plot(series, { color, width });
plotHist(series, { color });
plotShape(cond, { shape, color, location });
hline(70, { color: '#ef5350', style: 'dashed' });
bgColor(cond, { color });
label({ bar: 0, price: close.value, text: 'Now' });
The ta.* library
Full SDK referencesmaemarmawmahmadematemavwmaalmaswmarsimacdstochccimfiroccmotsiwprcogstdevatrtrbbandskeltnerdevvariancesupertrendadxsarlinregcorrelationobvvwapadcrossovercrossunderhighestlowestrisingfallingbarssincevalueWhenpivotHighpivotLowCodeLab FAQCommon questions.
What is CodeLab?
CodeLab is the code editor built into the ChartLabs chart. You write indicators and strategies in TypeScript, run them on the chart you have open, backtest strategies in the Backtest tab, and publish scripts to the community or keep them private.
Can I import a Pine Script indicator?
Yes. In CodeLab, choose Import from Pine Script, paste your source and press Convert. The importer is built for Pine Script v5 and v6. Anything it cannot translate becomes a TODO comment in the output, and it lists warnings where results can differ from TradingView, so compare the result with the original before you rely on it.
Can I convert a Pine strategy?
Yes. The importer translates the orders of a script that starts with strategy(), and keeps its settings for capital, commission and slippage. Open the Backtest tab to see the trades. Backtest results are hypothetical and do not predict future results.
Do I need to install anything?
No. CodeLab runs inside ChartLabs on the web and in the app. Scripts run in a worker thread, so a slow script does not freeze the chart.
Can AI write a script for me?
The AI in CodeLab can generate a script from a description, explain code, find and fix errors, change an existing script, or chat about it. Each request uses AI credits.
Where is the full SDK reference?
The full reference for indicator(), Series, the ta functions, inputs, plots, drawings, security() and strategy, with working recipes, is on the CodeLab docs page at chartlabs.co/docs.
Open a file.
Put it on your chart.
Start from a template, import a Pine Script, or ask the AI for a first draft.