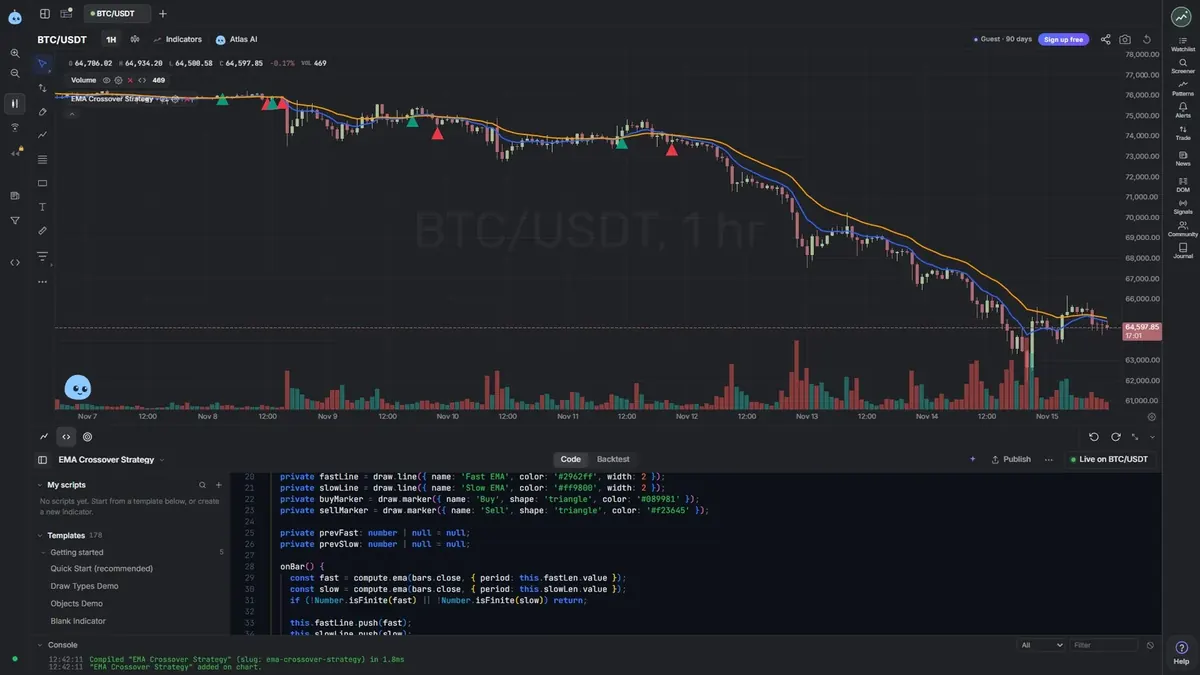
350+ technical indicators.
One click.
Free technical indicators with live charts and plain-English guides. Most are free on every plan; the Elite Signals indicators marked Ultimate need the Ultimate plan.
RSI (14, close, 14)
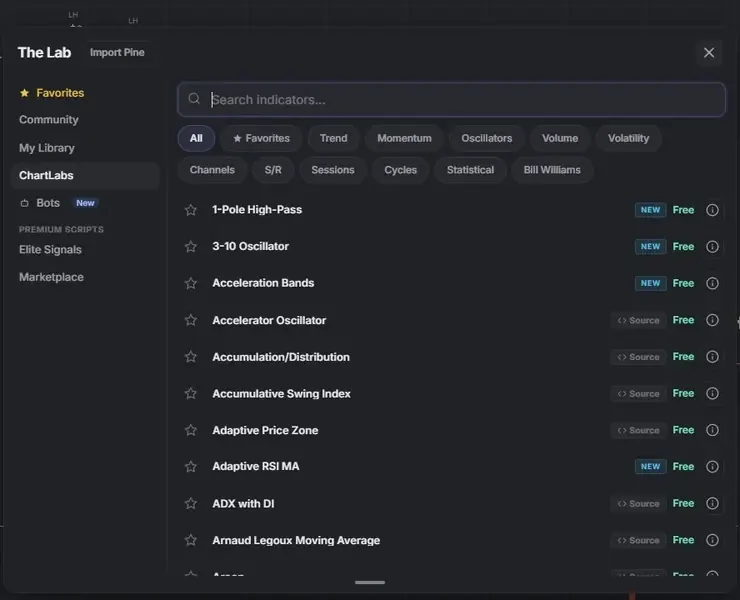
350+ to choose from
Popular indicatorsWhat traders add first.
All free on every plan.
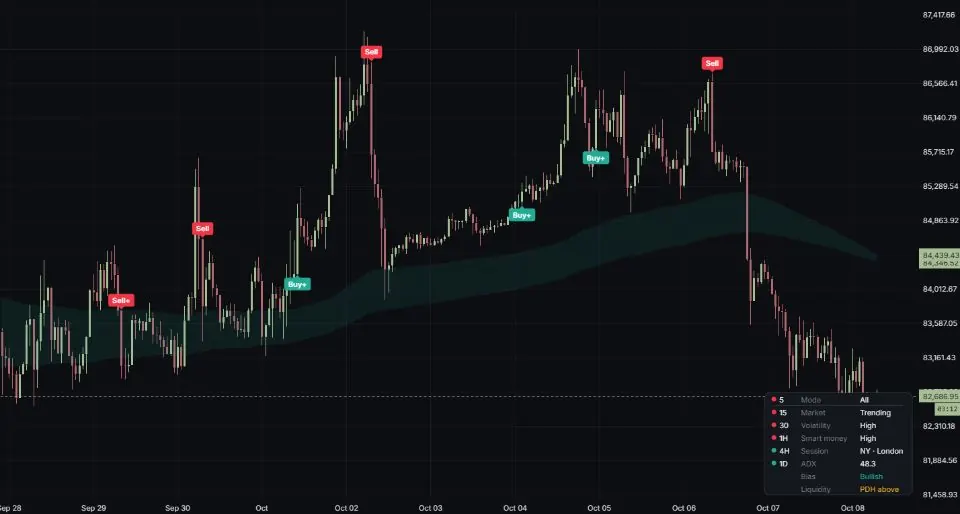
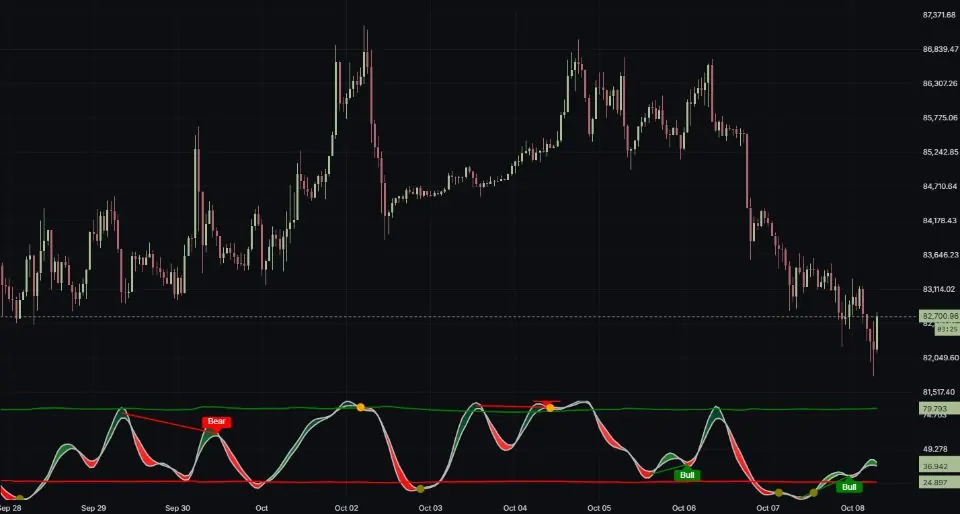
Elite Signals indicatorsPremium tools.
Built by Elite Signals.
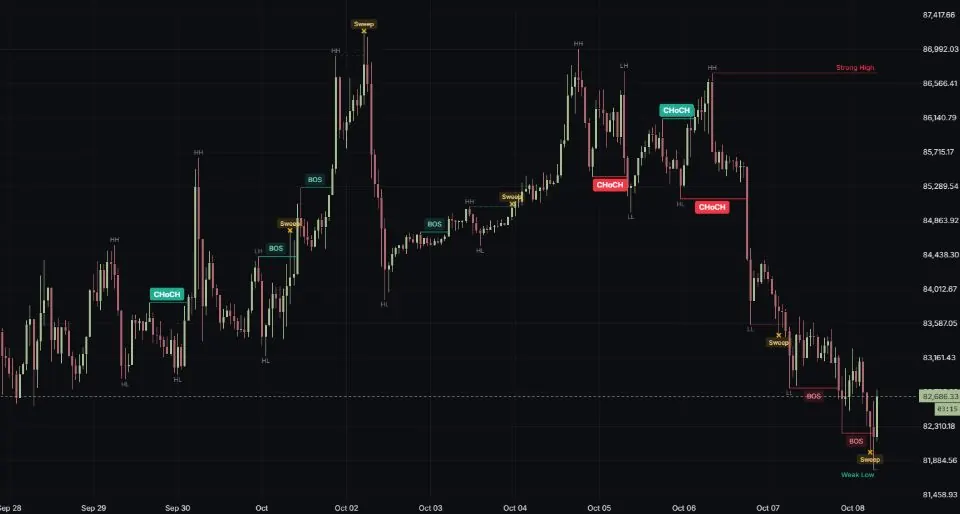
Trend indicators71 trend indicators
Direction and strength of a move.
Momentum indicators85 momentum indicators
How fast price is moving, and when it is stretched.
Volume indicators47 volume indicators
Who is behind the move, and how much.
Volatility indicators50 volatility indicators
How wide price swings, and when it may expand.
Channels indicators10 channels indicators
Bands and channels that frame price.
Support and resistance indicators23 support and resistance indicators
Levels where price tends to stall or turn.
Sessions indicators12 sessions indicators
Session ranges, VWAP and volume by session.
Cycles indicators14 cycles indicators
Filters that isolate the rhythm in price.
Statistical indicators37 statistical indicators
Price maths: deviation, regression, correlation.
Bill Williams indicators6 bill williams indicators
The Alligator family by Bill Williams.
A to ZEvery indicator.
#
3-10 OscillatorA
Acceleration BandsAccelerator OscillatorAccumulation/DistributionAccumulative Swing IndexAchelis Range Expansion IndexAdaptive Price ZoneADX with DI+/DI-Arnaud Legoux Moving AverageAroonAroon OscillatorATR PercentATR Trailing StopATR Volatility RatioAuto Fibonacci LevelsAverage Daily RangeAverage Directional Movement IndexAverage Directional Movement Index RatingAverage Gain to Average LossAverage True RangeAwesome OscillatorB
Balance of PowerBar Range / Average RangeBar Range PercentileBlau Double Smoothed StochasticBollinger / Keltner Width RatioBollinger BandsBollinger Bands %BBollinger BandWidthBollinger Width PercentileBreakout IntensityC
Camarilla Pivot PointsCandle Body PercentCandle Body to Range RatioCenter Of GravityCentral Pivot RangeChaikin Money FlowChaikin OscillatorChaikin VolatilityChande Dynamic Momentum IndexChande Forecast OscillatorChande Kroll StopChande Momentum OscillatorChande Trend ScoreChandelier ExitChoppiness IndexClassic Pivot MidpointsClose Location in BarClose Location ValueClose-to-Close Historical VolatilityCommodity Channel IndexComparative Relative StrengthConnors RSIConsecutive Up ClosesCoppock CurveCorrelation CoefficientCumulative Signed RangeCumulative Volume Delta (bar close)Cutler's RSID
Darvas BoxDeMark Pivot PointsDeMarker OscillatorDetrended Price OscillatorDeviation To MADirectional MovementDirectional Movement IndexDisparity IndexDonchian ChannelDonchian Channel (filled)Donchian Percent BDonchian WidthDorsey InertiaDouble EMA OscillatorDouble Exponential Moving AverageDownside Semi-DeviationE
Ease of MovementEhlers 1-Pole High-Pass FilterEhlers 2-Pole ButterworthEhlers 2-Pole Gaussian FilterEhlers 2-Pole High-PassEhlers Band-Pass FilterEhlers Correlation Trend IndicatorEhlers Cyber CycleEhlers DecyclerEhlers Decycler OscillatorEhlers Distance Coefficient FilterEhlers Even Better SinewaveEhlers Fisher TransformEhlers Hann Window AverageEhlers Instantaneous TrendlineEhlers Laguerre FilterEhlers MyRSIEhlers ReflexEhlers Roofing FilterEhlers Stochastic Cyber CycleEhlers Super PassbandEhlers SuperSmootherEhlers SuperSmoother OscillatorEhlers TrendflexEhlers Ultimate SmootherElastic Volume Weighted MAElder Auto EnvelopeElder Force IndexElder Impulse SystemElder RayElder ThermometerElite OscillatorElite Oscillator ProElite Price ActionEliteAlgo ONEEliteAlgo V35EnvelopeExponential Moving AverageF
Fibonacci Pivot PointsFisher TransformForecast OscillatorFractal Adaptive Moving AverageFractal Adaptive Moving AverageFractal Chaos BandsFractal Dimension IndexG
Gann HiLo ActivatorGarman-Klass Historical VolatilityGator OscillatorGRIGuppy Multiple Moving AverageH
Half TrendHeikin Ashi SmoothedHeikin-Ashi OscillatorHigh Low BandsHigh Low Moving Average ChannelHigh Low Range PercentHigh Minus LowHighest High / Lowest LowHighest Lowest Percent BHistorical VolatilityHull Moving AverageHull Moving Average OscillatorHurst Exponent (R/S)I
Ichimoku CloudInitial BalanceInitial Balance ExtensionInside Bar PercentIntraday IntensityIntraday Momentum IndexIntraday Return PercentInverse Fisher Transform of RSIK
Kaufman Adaptive MA OscillatorKaufman Adaptive Moving AverageKaufman Efficiency RatioKDJ StochasticKeltner ChannelKeltner Channel (filled)Keltner Channel WidthKeltner Percent BKeltner Z-ScoreKey Reversal DownKey Reversal UpKlinger OscillatorKnow Sure ThingL
Laguerre RSILeast Squares Moving AverageLinear Regression AngleLinear Regression ChannelLinear Regression ForecastLinear Regression InterceptLinear Regression R-SquaredLinear Regression ResidualLinear Regression SlopeLinear Regression Slope PercentLinear Regression Standard Error BandsLo–MacKinlay Variance RatioLog ChangeLower Wick PercentM
MACDMACD EnhancedMarket Facilitation IndexMass IndexMaximumMcGinley DynamicMcGinley Dynamic EnhancedMean Absolute DeviationMedian Absolute Deviation ChannelMedian PriceMedian Price OscillatorMESA Adaptive Moving AverageMidpoint OscillatorMinimumMomentumMomentum PercentileMoney Flow IndexMonthly Pivot PointsMoon PhasesMoving Average Envelope (filled)N
N-Bar Cumulative ReturnNadaraya-WatsonNBars DownNBars UpNegative Volume IndexNet VolumeNet Volume PercentO
OBV Deviation PercentOBV OscillatorOn Balance VolumeOpening Gap PercentOpening RangeOscillator of Moving AverageOutside Bar PercentOvernight High and LowP
Parabolic SARParkinson Historical VolatilityPatternsPercent RankPercentage Volume OscillatorPerformance IndexPivot PointsPolarized Fractal EfficiencyPositive Volume IndexPPOPretty Good OscillatorPrevious Month High Low ClosePrevious Session High Low ClosePrevious Week High Low ClosePrice ChannelPrice OscillatorPrice to EMA PercentPrice Volume CorrelationPrice Volume TrendPrice Zone OscillatorPrime Number BandsPrime Number OscillatorPring Special KProjection BandsProjection OscillatorPsychological LineQ
QstickQualitative Quantitative EstimationR
Raff Regression ChannelRainbow Moving AverageRainbow OscillatorRandom Walk IndexRangeRange Action Verification IndexRate Of ChangeRealized VarianceRealized VolatilityRelative Momentum IndexRelative Spread StrengthRelative Strength IndexRelative Strength Index with Moving AverageRelative Vigor IndexRelative Volatility Index (Dorsey)Relative VolumeRINDRogers-Satchell Historical VolatilityRolling AutocorrelationRolling Drawdown PercentRolling Excess KurtosisRolling Interquartile RangeRolling MedianRolling SkewnessRolling VarianceRolling Z-ScoreRSI Adaptive Moving AverageRSI MomentumS
Schaff Trend CycleSession Cumulative VolumeSession High and LowSession MidpointSession Time Weighted Average PriceSession TWAP Deviation %Session Volume ProfileSession Volume Weighted Average PriceSession VWAP Deviation %Session VWAP Standard Deviation BandsSession VWAP Z-ScoreSigned Volume EMASimple Moving AverageSimple Moving Average of True RangeSine Weighted Moving AverageSMA of Opening Gap PercentSMA Spread PercentSmoothed Moving AverageSqueeze MomentumStandard Deviation ChannelStandard Deviation PercentStdDevStochasticStochastic Momentum IndexStochastic RSIStochastic SpreadStochastics FastStoller Average Range ChannelsSumSuperTrendSwing IndexT
Tillson T3 Moving AverageTillson T3 OscillatorTime Series ForecastTrade Volume IndexTraplineTrendTrend Intensity IndexTrend MagicTrend Trigger FactorTriangular Moving AverageTriple EMA OscillatorTriple Exponential Moving AverageTRIXTrue RangeTrue Range PercentTrue Range PercentileTrue Strength IndexTwelve Flow IndexTwiggs Money FlowTypical PriceTypical Price OscillatorU
Ulcer IndexUltimate OscillatorUp Volume RatioUpper Wick PercentV
Variable Index Dynamic AverageVariable Moving AverageVertical Horizontal FilterVisible Range Volume ProfileVolumeVolume ClimaxVolume Moving AverageVolume OscillatorVolume Percent RankVolume Rate of ChangeVolume Standard DeviationVolume to SMA RatioVolume Up DownVolume Weighted Average PriceVolume Weighted Moving AverageVolume Weighted RSIVolume Z-ScoreVolume Zone OscillatorVolume-Weighted MACDVortex IndicatorW
WaveTrend OscillatorWeekly Pivot PointsWeighted CloseWeighted Close OscillatorWeighted Moving AverageWelles Wilder SmoothingWick ImbalanceWilliams %RWilliams Accumulation DistributionWilliams AlligatorWilliams FractalsWoodie Commodity Channel IndexWoodie Pivot PointsY
Yang-Zhang Historical VolatilityZ
Zero Lag Exponential Moving AverageZero-Lag EMA OscillatorZero-Lag Simple Moving AverageZero-Lag Triple EMAZig ZagZigZag PercentNeed one that is not here?
Build it in CodeLab.
Write your own indicator in TypeScript, or paste a Pine script into the importer to convert it.