How to Read Candlestick Charts (With Real Chart Examples)
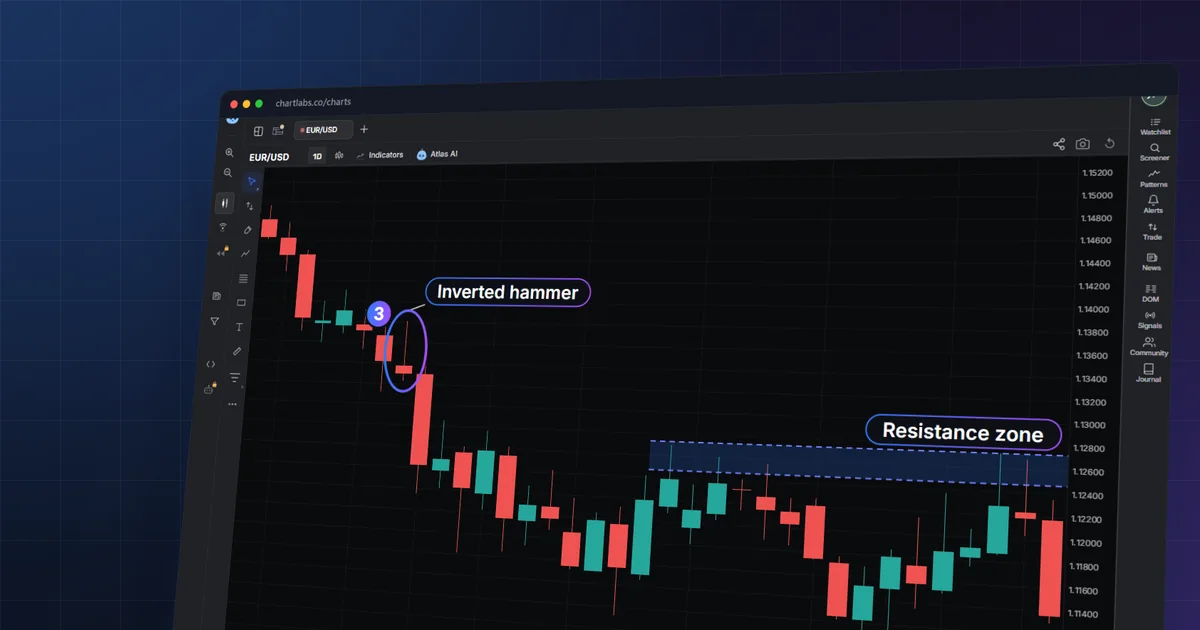
You open a chart and see rows of red and green bars with thin lines poking out of both ends. Some are tall, some tiny, and nobody told you which ones matter.
Here is how to read candlestick charts: each shape packs four prices into one picture. You will be able to decode any candle, judge it in context, and recognise when a signal has failed.
How to read a candlestick chart in 5 steps:
- Read the open, high, low and close of one candle.
- Compare the close with the open for colour and direction.
- Judge the body and wicks against the trend before it.
- Mark support and resistance zones and swings nearby.
- Wait for the next candle, then size the risk from entry to stop.
What does one candlestick show?
A candlestick summarises one timeframe, the period each candle covers, such as one hour or one day. It records four prices: the open (first price of the period), the high (the highest price reached), the low (the lowest) and the close (the last price). The thick part is the body. It spans from the open to the close. The thin lines above and below are wicks (also called shadows), and they reach the high and the low [1].


Candlesticks carry the same open-high-low-close data as bar charts [2]. Only the drawing differs. The four prices are objective, and subjectivity enters when a chart pattern is interpreted [2]. Reading a candle starts with describing it accurately, and only then interpreting it.
Take a real case. The EURUSD daily candle for 2026-11-04 opened at 1.11867, reached a high of 1.12728, dipped to 1.11860 and closed at 1.12277. The body is the gap between 1.11867 and 1.12277. The upper wick runs from the close up to 1.12728, and the lower wick is almost nothing.
Bullish vs bearish candles
The relationship between close and open sets the candle's direction. If the close is above the open, price rose over the period and the candle is bullish. If the close is below the open, price fell and the candle is bearish.
Colour is only a label for that relationship. Many platforms paint bullish candles green and bearish ones red, but the colour depends on software settings [1]. Some charts use hollow and filled bodies, or blue and white. Check your platform's legend before assuming.
Two real daily candles show the difference. On 2026-11-04 EURUSD opened at 1.11867 and closed at 1.12277, so the close was above the open: bullish. On 2026-11-06 it opened at 1.12172 and closed at 1.11367, well below the open: bearish. That candle also had a low of 1.11311, so the close sat near the bottom of its range.
A body that is nearly absent means open and close were almost equal. That shape is a doji. On 2026-11-05 EURUSD opened at 1.12229 and closed at 1.12181 while ranging between 1.12032 and 1.12681. The wicks were many times longer than the body. The day contained movement but ended almost where it started.
How do line, bar and candlestick charts compare?
All three draw the same market. They differ in how much of each period's data they show.
| Chart type | What it shows | Best use |
|---|---|---|
| Line | One price per period, usually the close, joined by a line | Seeing the broad path of price without noise |
| Bar (OHLC) | Open, high, low and close as a vertical line with side ticks | All four prices of each period [2] |
| Candlestick | The same four prices, with the open-to-close body drawn as a block | Body and wick sizes show which side was in control [1][2] |
Candlesticks and bars show the same open, high, low and close data [2]. Candles are simply easier to scan, because the body makes direction visible without comparing tick marks.
What do wicks and body size say?
The body tells you who controlled the period's end. The wicks tell you what price tried and failed to hold.
- Long upper wick: price rose, then sellers pushed it back down before the close.
- Long lower wick: price fell, then buyers pushed it back up.
- Little or no wick: price closed at or near an extreme, so the move was one-sided.
- Wicks on both sides with a small body: a stand-off, as in the doji above.
Size matters relative to recent candles. A body is "long" only if it is large next to the bars around it. On the gold 4-hour chart, the candle starting 2026-11-04 04:00 UTC opened at 3934.37 and closed at 4022.50, a range 3.3 times the average bar, and it closed near its high.
Wicks do not give a verdict by themselves. A long upper wick after a long rally is read differently from one after a long drop. That is why context matters.
Hammer vs hanging man: same shape, different meaning
A hammer has a small body near the top of the candle and a long lower wick. A working rule of thumb used on this page, not an official definition: the lower wick is at least about twice the body, there is little or no upper wick, and it appears after a decline. The hanging man has the identical shape, but it appears after a rise.
After a fall, a long lower wick suggests buyers stepped in. After a rise, the same wick may suggest early weakness. Neither is a command. Both are prompts to check what the next candle does.
The same applies to the upside-down pair. A shooting star has a small body at the bottom and a long upper wick after a rise. An inverted hammer has the same shape after a decline.
On the EURUSD hourly chart, the candle at 2026-11-04 13:00 UTC was a shooting star: open 1.12635, high 1.12728, low 1.12581, close 1.12601, with an upper wick 2.7 times the body. The next hour closed at 1.12491, below its low. Two days later, the 2026-11-06 14:00 UTC candle was a hammer (open 1.11454, low 1.11311, close 1.11502, lower wick 3.0 times the body). A later bar, 16:00 UTC, closed at 1.11532, above the hammer's high of 1.11505. But the 15:00 UTC candle, an inverted hammer (open 1.11497, high 1.11601, close 1.11448), failed: the 18:00 UTC bar closed at 1.11444, below its low.

Which candlestick patterns are worth knowing?
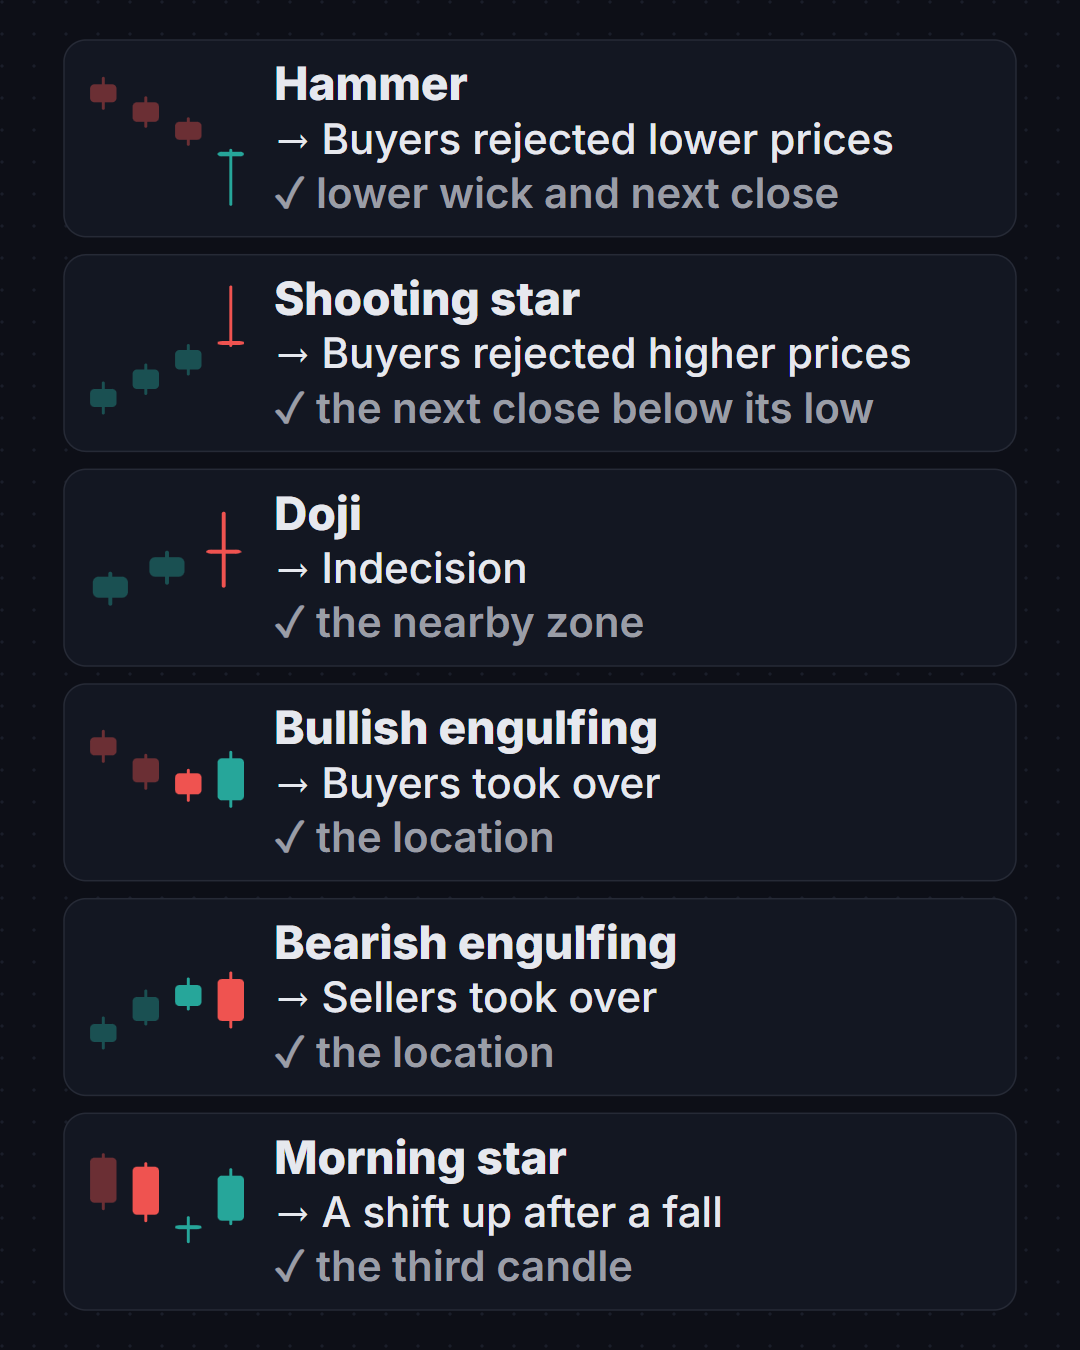
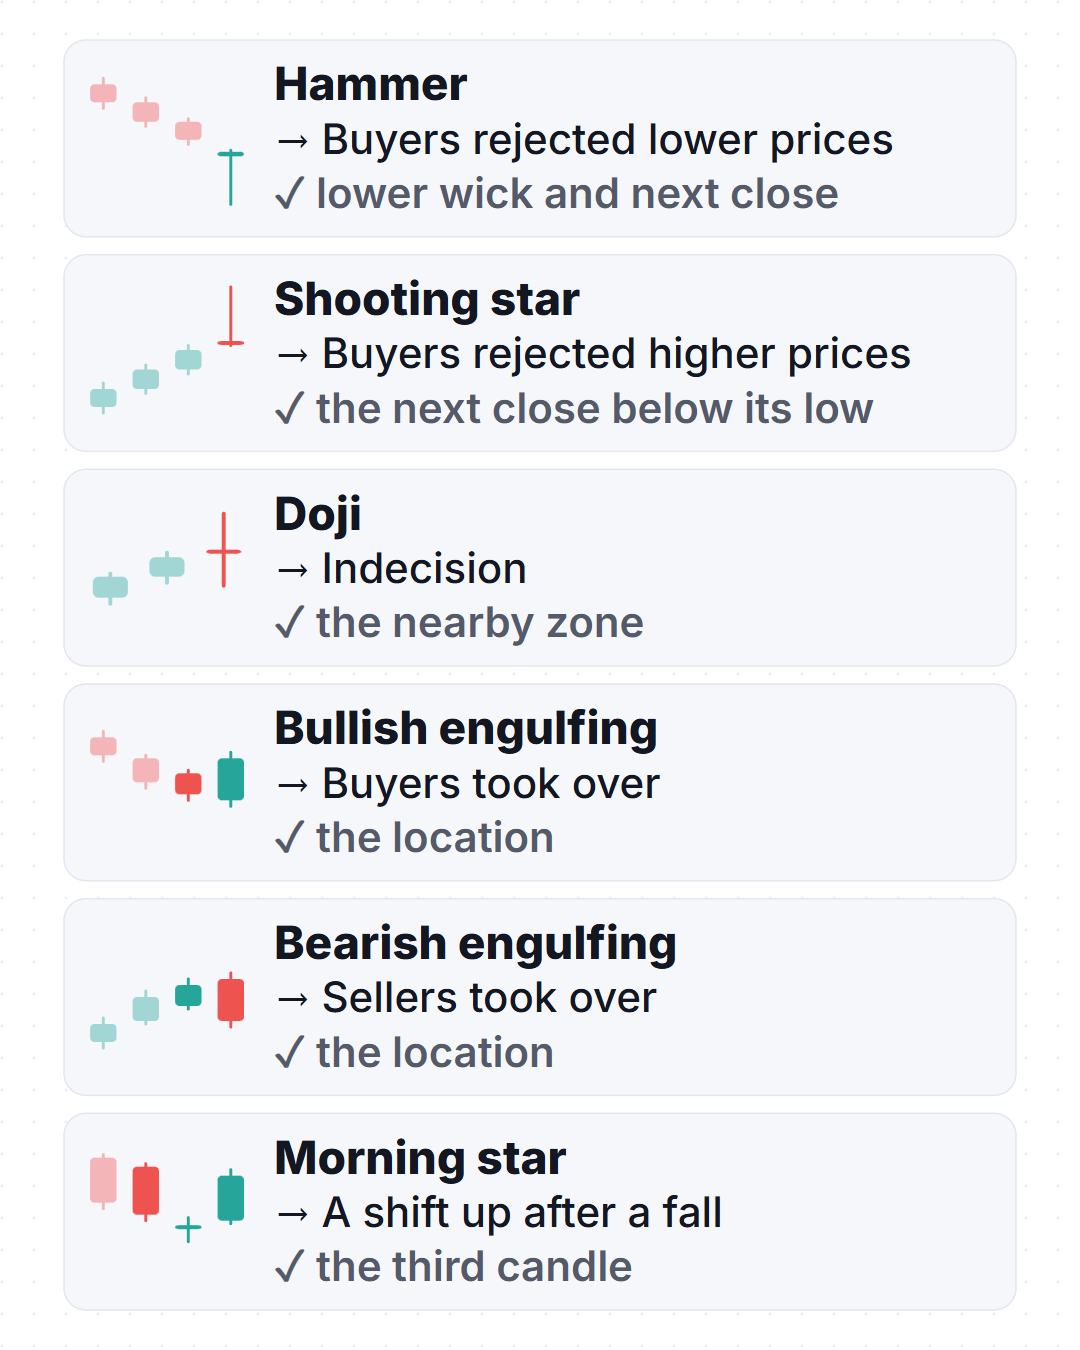
Patterns combine one to three candles into a named shape. Interpreting chart patterns is subjective, although the charts themselves are objective [2]. Read each row below as a description plus a question to check.
| Shape | Pattern | What it may suggest | What to check |
|---|---|---|---|
 | Hammer | Buyers rejected lower prices after a decline | Wick at least about twice the body; next candle closes higher |
 | Hanging man | Early weakness after a rise | Appears after an advance; next candle closes lower |
 | Shooting star | Buyers rejected higher prices after a rise | Long upper wick; next close below its low |
 | Inverted hammer | Possible stall in a decline | Needs a follow-through close above its high |
 | Doji | Indecision, open and close nearly equal | Where it sits: at a zone or mid-range |
 | Bullish engulfing | Buyers overpowered the prior down candle | Body covers the previous body; location near support |
 | Bearish engulfing | Sellers overpowered the prior up candle | Body covers the previous body; location near resistance |
 | Morning star | Three-candle shift from down to up | Middle candle small; third closes well into the first |
 | Evening star | Three-candle shift from up to down | Middle candle small; third closes well into the first |
 | Bullish harami | Selling momentum slowing | Small body inside the prior large down body |
 | Piercing line | Partial recovery after a down candle | Closes above the midpoint of the prior body |
 | Dark cloud cover | Partial reversal after an up candle | Closes below the midpoint of the prior body |
Does volume matter on a candlestick chart?
Volume is the amount traded during a candle, usually shown as bars under the chart. On exchange-traded markets such as stocks and futures, it counts shares or contracts. A large move on unusually high volume carries more participation than the same move on thin volume.
Forex works differently. Spot forex has no single central exchange, so most charts show tick volume: the number of price changes during the candle, not traded size. It can show when the market was busy or quiet, but not how much money changed hands.
When does the forex daily candle close?
A daily candle closes when the platform says a "day" ends. In forex, brokers and data providers set that cut-off, and many pick a late-afternoon New York time. Others use midnight UTC or server time. Open, high, low and close for the "same day" can therefore differ between platforms.
The daily candles in the ChartLabs captures used on this page are UTC days. If you compare them with a broker chart that rolls at another time, expect different opens and closes. When a pattern depends on the exact close, confirm your platform's day boundary first.
The daily candle is built from the smaller ones inside it. Watching the hourly and daily charts together shows how the same day formed.
How do you mark zones and swings around a candle?
A candle only means something relative to its surroundings. Mark three things before judging any shape.
A swing high is a peak with lower prices on both sides. A swing low is a trough with higher prices on both sides. Chains of them describe the trend: higher highs and higher lows for an uptrend, lower highs and lower lows for a downtrend.
Support is a price area where falls have previously paused. Resistance is where rises have previously stalled. Draw them as zones, not single lines, because price rarely turns at one exact tick.
A break of structure happens when a close passes beyond the last swing that defined the trend, for example a close above the last lower high. It suggests the old sequence may be changing. It does not guarantee the new one.
Use a higher timeframe to place the zone, then drop to a lower one to see the candle's detail. You can mark zones on any symbol with a free chart, and price alerts can tell you when price reaches one.
Worked example: EURUSD on the daily chart
The EURUSD daily chart from 2026-09-20 to 2026-11-06 fell from a high of 1.14956 on 2026-09-21 to a low of 1.11043 on 2026-10-29. The first close was 1.14632 and the last was 1.11367. No daily break of structure appeared in this window.
- Support Z1 (1.11043–1.11356) was touched on 2026-10-14 and 2026-10-29.
- Resistance Z2 (1.12465–1.12728) was touched on 2026-10-16 and 2026-11-04.
- K1, 2026-09-30: an inverted hammer after a decline (open 1.13373, high 1.13803, low 1.13223, close 1.13292). The next day closed at 1.12423, below its low. The signal failed.
- K4, 2026-10-09: another inverted hammer (open 1.12082, close 1.11973). On 2026-10-12 price closed at 1.11548, below its low. It failed too.
- K5, 2026-10-13: a bullish engulfing candle (open 1.11516, close 1.11982). On 2026-10-15 price closed at 1.12184, above K5's high of 1.12046.
- Swings: the lower low at 1.11043 on 2026-10-29 sat inside Z1, and the higher high at 1.12728 on 2026-11-04 sat at the top of Z2.
Not every engulfing candle worked out. On 2026-10-06, a bullish engulfing candle (K3) was followed on 2026-10-07 by a close at 1.11953, below its low.

Worked example: gold on the 4-hour chart
The XAUUSD 4-hour chart runs from 2026-10-16 to 2026-11-06. It opened with a close of 4183.26 at 2026-10-16 00:00 UTC, fell to a low of 3870.20 at 2026-10-30 16:00 UTC, and ended at 4070.89.
- K1, 2026-10-23 08:00 UTC: a bullish engulfing candle after a decline (open 4011.54, close 4024.42). The next bar closed at 4003.49, below its low. It failed.
- B1, 2026-10-27 12:00 UTC: a close at 4063.70 above the last lower high at 4029.94, a break of structure. A later bullish engulfing (K3 at 2026-10-28 16:00 UTC) failed as well, and price went on to the 3870.20 low.
- B2, 2026-11-04 04:00 UTC: a long bullish body (open 3934.37, close 4022.50) closed above the last lower high at 3970.24. The next bar closed at 4041.57, above its high.
- Resistance Z2 (4134.28–4146.93) was touched at 2026-10-21 20:00 UTC and again at 2026-11-05 00:00 UTC, when a long bullish candle reached 4146.93 and closed at 4140.51.
Later bars on 2026-11-05 closed lower, at 4083.40 by 12:00 UTC, so the zone acted as a ceiling in that window.

How do you size risk before acting on a candle?
Reading a candle tells you where a trade idea would be wrong. Position size follows from that distance. Use the entry-to-stop distance, never a buffer you add afterwards.
A pip is the standard small price step in forex, 0.0001 for most pairs. Spread is the gap between the buy and sell price. Leverage means controlling a position larger than your deposit, which magnifies both gains and losses. Slippage is the difference between the price you expected and the price you actually got.


The stop belongs where the candle's idea fails, such as beyond the wick extreme or the zone. A tighter stop does not make a trade safer if price routinely reaches it.
What mistakes cost traders when reading candles?
- Judging a candle before it closes.
- Naming a shape without checking the trend before it.
- Ignoring location.
- Treating a pattern as a promise.
- Reading one timeframe only.
- Comparing candles across platforms with different day boundaries.
- Reading tick volume as traded size.
- Setting stops by habit instead of by the candle's own extreme.
When this doesn't work
Interpreting a chart pattern involves subjectivity, and technicians can read the same chart in different ways [2]. Signals cluster in noisy ranges, news can overrun any zone, and thin markets distort wicks. A shape that worked on one symbol or timeframe tells you little about the next.
Leveraged products can lose money quickly, and national regulators across EU jurisdictions found that 74–89% of retail CFD accounts typically lose money [3][7]. The UK regulator describes CFDs as complex, high-risk products with a considerable risk of substantial losses [4], and US futures disclosures state that leverage can lead to large losses as well as gains [5].
Common questions
What do the colours on a candlestick chart mean?
Colour marks whether the close finished above or below the open. Green and red are typical colours for up and down candles, but the colour depends on the colour settings of your software. Check your platform's legend so you do not read a bullish candle as bearish, and compare it with the open before drawing any conclusion.
Which timeframe is best for reading candles?
There is no single best one. Daily candles move slowly and show the broad picture, while hourly candles show more detail and more noise. Use a higher timeframe to place zones, then a lower one to see the candle's detail, and confirm your platform's day boundary first.
What is the difference between a hammer and a hanging man?
They share the same shape: a small body and a long lower wick. A hammer appears after a decline, and a hanging man appears after a rise. Check what the next candle does before acting, and look at the trend before the candle to tell which name applies.
Do candlesticks predict price?
No. Candlesticks record what price did, using the open, high, low and close of each period. Interpreting a pattern involves subjectivity, so treat each shape as a question to check rather than a forecast, and confirm it with the next candle and nearby zones.
Sources
- CME Group, Chart Types: candlestick, line, bar, 2025. https://www.cmegroup.com/education/courses/technical-analysis/chart-types-candlestick-line
- CME Group, Technical Analysis, 2025. https://www.cmegroup.com/education/courses/trading-and-analysis/technical-analysis
- ESMA, ESMA agrees to prohibit binary options and restrict CFDs to protect retail investors, 2018. https://www.esma.europa.eu/press-news/esma-news/esma-agrees-prohibit-binary-options-and-re
- FCA, FCA warns investors in CFDs risk losing out on protections, 2025. https://www.fca.org.uk/news/press-releases/fca-warns-investors-cfds-risk-losing-out-protec
- Cornell LII (eCFR), 17 CFR 1.55: Public disclosures by futures commission merchants, 2024. https://www.law.cornell.edu/cfr/text/17/1.55
- ESMA, Notice of ESMA's Product Intervention Decisions in relation to CFDs and binary options, 2018. https://www.esma.europa.eu/sites/default/files/library/esma35-43-1135_notice_of_pi_decisio
Ready to read your first candle?
Open a chart and mark your first support or resistance zone.
Open a free chartEducational content, not financial advice. This guide is general education; trading leveraged products can lose more than you expect, so consider your own circumstances.