Best Timeframe for Day Trading (With Real Chart Examples)
The best timeframe for day trading is the one that matches your hours and your costs, yet every chart you open seems to disagree. The 1-hour shows a drop, the 5-minute shows a bounce, and the daily draws a level neither one respects.
You will leave able to choose a higher and lower chart pair, check it against costs, and read both on real EURUSD and gold charts.
How to choose a day trading timeframe in 4 steps:
- Fix your trading window.
- Pair a higher and lower timeframe.
- Check costs against bar size.
- Test the pair on past data.
What does a timeframe change on a chart?
The diagram below shows one day drawn two ways: as a single daily candle and as a row of hourly candles. The rest of this guide uses that idea to choose a chart pair.


Step 1: Fix your trading window
Start with time, not indicators. Choose a timeframe you can actually watch during your trading window.
Next, check when your market is open. Some futures, such as E-mini S&P 500, run for most of the day:
Account rules can also limit how much you can trade through buying power restrictions [1]. In the US, a pattern day trader is a designation for accounts that day trade frequently [3]. The SEC has approved FINRA's change to Rule 4210, which replaces the day trading margin provisions with intraday margin standards [4]. Earlier margin rules set day trading buying power limits and margin calls under the pattern day trader framework [1]. Confirm with your broker which rules apply to your account now.
Then pick markets that are moving during your window. Use the market scanner to find them.
Step 2: Pair a higher and lower timeframe
One chart cannot tell you both where the market is heading and when to act. So use two. The higher timeframe gives direction and levels. The lower timeframe gives the entry.
On the higher chart, mark the recent swing highs and swing lows and any support or resistance zones.
On the lower chart, wait for price to reach one of those zones and read the candles there. Pick a pair with a clear gap between the two timeframes.
Set a price alert on a chart at the higher-timeframe zone. Then the lower chart needs your attention only when price arrives.


Step 3: Check costs against bar size
Slippage is the difference between the price you expected and the price you actually got [10]. In forex, price moves in pips, the standard small price step of a currency pair [9].
Compare the spread with the size of your stop on the entry chart.
Size the position from the distance between your entry and your stop, never from a buffer added on top:
To check a pair, look at a recent stretch of candles on the entry chart and note a typical range. Then ask where a stop beyond the nearest swing would sit against that range and against your spread. If the spread eats a large share of the stop, move to a higher timeframe or skip that market.
Step 4: Test the pair on past data
Test the pair on past data before you trade it. Judge the pair on how the rules behaved across the whole sample, not on the best-looking trade.
For each pair you test, write down four things:
- The two timeframes and the market.
- The number of signals in the sample.
- How many of them failed.
- The stop distance against the spread.
ChartLabs offers multi-chart layouts and backtesting on historical data. You can open several timeframes side by side in a multi-chart layout.
Change one thing at a time. If you move both timeframes and the stop rule together, you will not know which change mattered.
Day trading and swing trading compared
Under FINRA rules, a day trade is buying and selling (or short-selling and covering) the same security on the same day in a margin account [1]. Day trading involves actively buying and selling securities within the same day, trying to capitalize on short-term changes in price [2].
A position held across several days falls outside that definition. Decide your holding time first, and let the timeframe pair follow from it.
The markets overview is at chartlabs.co/markets.
Worked example: EURUSD on the daily and hourly charts
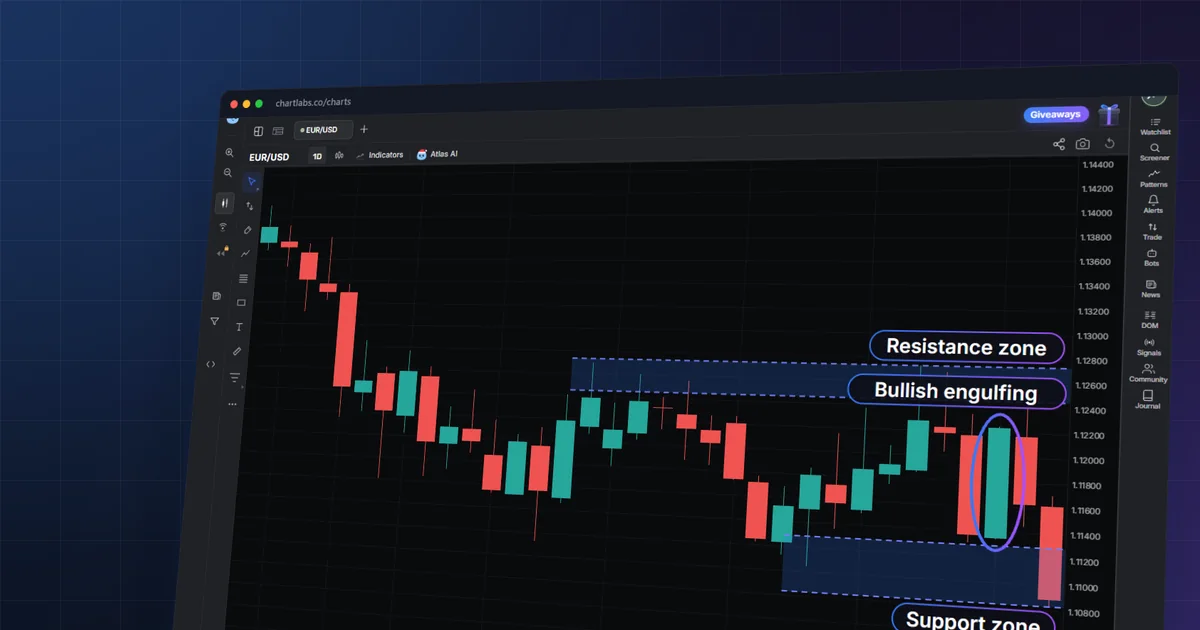
The EURUSD daily chart runs from 2026-09-25 to 2026-11-11 in 34 bars. It opens with a close of 1.13902 on 2026-09-25 and ends with a close of 1.10886 on 2026-11-11.

Take the marks in order. Z1 is a resistance zone from 1.12449 to 1.12728, touched on 2026-10-16 and 2026-11-04. Z2 is a support zone from 1.10827 to 1.11287, touched on 2026-10-29 and 2026-11-11.
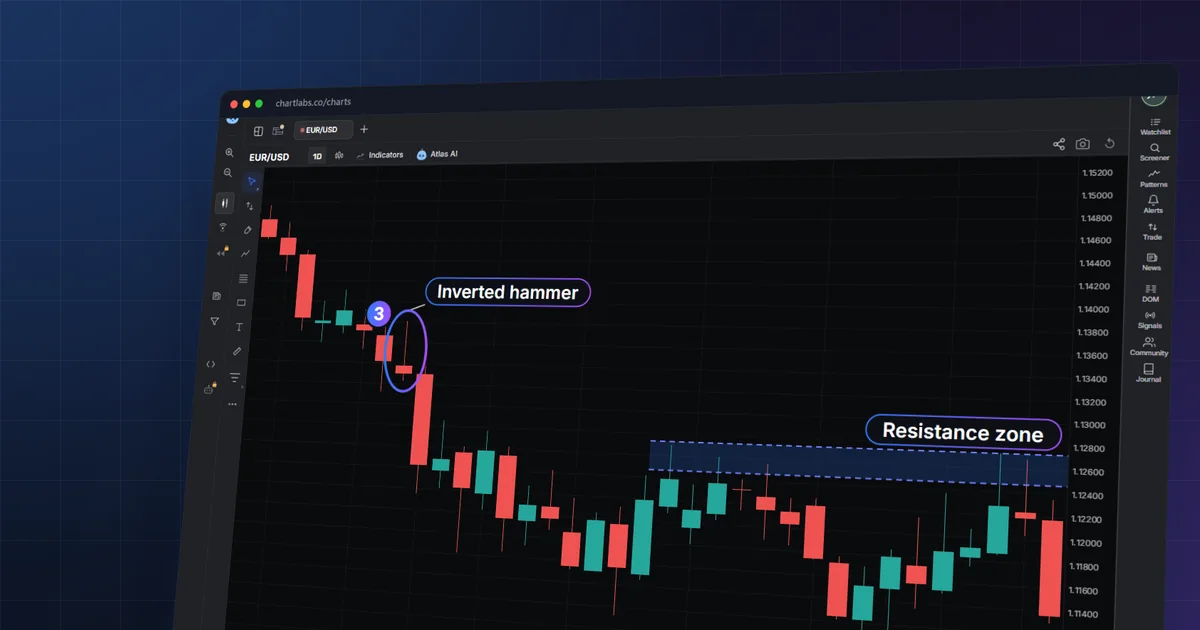
K1 on 2026-09-30 is an inverted hammer: a small body with a long upper wick, here 5.3 times the body (O 1.13373, H 1.13803, L 1.13223, C 1.13292). It failed. The next day, 2026-10-01, closed at 1.12423, below its low.
K4 on 2026-10-13 is a bullish engulfing candle, where an up body covers the previous down body (O 1.11516, C 1.11982). It was confirmed. Two days later, 2026-10-15, the close at 1.12184 sat above its high of 1.12046.
K8 on 2026-11-09 is another bullish engulfing candle (O 1.11350, C 1.12238). It failed. The 2026-11-11 candle closed at 1.10886, below the K8 low of 1.11346.
Now the same market on the hourly chart. It covers 2026-11-07 to 2026-11-11 in 74 bars, with a high of 1.12513 on 2026-11-10 08:00 UTC and a low of 1.10827 on 2026-11-11 14:00 UTC.

K1 on 2026-11-09 21:00 UTC is a bullish engulfing candle with a full range of 1.12194 to 1.12248. The next candle closed at 1.12191, below its low, so it failed. K3 on 2026-11-10 01:00 UTC is an inverted hammer (O 1.12207, C 1.12224) that also failed, as the 02:00 candle closed at 1.12197 below its low.
S3 is the swing high at 1.12513 on 2026-11-10 08:00 UTC. K5 on 2026-11-10 13:00 UTC is a long bearish body, with a range 3.7 times the average bar (O 1.12141, C 1.11865). K8 on 2026-11-11 14:00 UTC is another long bearish body (O 1.11035, L 1.10827, C 1.10853).
The lesson sits in the contrast. The hourly chart produced failing signals within hours, and the larger bearish candles, such as K5 with a range 3.7 times the average bar, only appeared later. The daily low of 1.10827 on 2026-11-11 is the same price as the hourly low at 14:00 UTC.
Worked example: gold on the 4-hour chart
The XAUUSD 4-hour chart covers 2026-10-21 to 2026-11-11 in 99 bars (times UTC). The range high was 4148.58 on 2026-11-09 20:00 UTC and the range low was 3870.20 on 2026-10-30 16:00 UTC.

Z1 is a resistance zone from 4134.28 to 4148.58, touched on 2026-10-21 20:00 UTC, 2026-11-05 00:00 UTC and 2026-11-09 20:00 UTC.
K1 on 2026-10-28 16:00 UTC is a bullish engulfing candle (O 4041.75, C 4075.25). It failed. The 2026-10-29 04:00 UTC candle closed at 4023.01, below the K1 low of 4025.31.
B1 is a break of structure: on 2026-11-04 04:00 UTC gold closed at 4022.50, above the last lower high S7 (3970.24).
B2 is the same idea in the other direction. On 2026-11-11 12:00 UTC gold closed at 4004.97, below the last higher low S10 (4027.34).
The two breaks sit just over a week apart (2026-11-04 04:00 and 2026-11-11 12:00 UTC), one up and one down. The chart records the shift each time and does not forecast the next one. K1 shows that a candle signal inside the range can still fail.
What mistakes cost traders when they choose a timeframe?
- Choosing the lowest chart because it shows the most signals. The hourly EURUSD signals K1 and K3 above both failed within hours.
- Trading from one chart. A single timeframe cannot give both direction and entry timing.
- Stacking three or four timeframes. Extra charts add conflicting readings without adding information.
- Ignoring spread and slippage on small bars. A stop that fits inside a few pips leaves little room for either.
- Sizing from a guessed buffer. Size the position from the entry-to-stop distance instead.
- Expecting a timeframe to remove failed signals. The captures show failures on the daily timeframe (K1 on 2026-09-30, K8 on 2026-11-09).
- Switching timeframes until the chart agrees with the trade you want. Fix the pair before the session and change it only after testing.
When this doesn't work
No timeframe fixes a weak method. A pair that reads cleanly on past charts can still fail in thin liquidity, around news releases, or when a market stops respecting its zones.
Leverage means controlling a position larger than the money you put up, and the SEC cautions that day trading is risky and can cause large losses, especially when it uses leverage [2].
The wider evidence is sobering. A 2014 Journal of Financial Markets study of day traders in Taiwan from 1992 to 2006 found that less than 1% of the day trader population is able to predictably and reliably earn positive abnormal returns net of fees [5]. National regulators' analysis of CFD trading across EU jurisdictions found that 74-89% of retail investor accounts typically lose money, and ESMA's agreed measures use a standard risk warning citing that range for CFD providers that are newly established or did not provide an open CFD connected to a CFD trading account in the last calculation period [8]. The FCA reported that an estimated 78% of active retail client accounts were loss-making, and that other EEA national regulators reported similar poor results for retail consumers [7].
Common questions
What is the best timeframe for day trading?
No single timeframe wins for every trader. A workable choice is a higher chart for direction and a lower chart for entries, picked to fit the hours you can watch and the costs you pay.
Is the 1-minute chart too fast for day trading?
It depends on whether you can watch continuously and whether costs leave room for your stop. Check costs against bar size on past data before using it.
Can I day trade from the daily chart alone?
Day trading involves buying and selling within the same day, so holding across several days falls outside that description.
Should the timeframe be the same in forex, crypto and stocks?
Not necessarily. E-mini S&P 500 futures, for example, trade Sunday through Friday, from 5 p.m. to 4 p.m. Central Time (CT). Test each market separately.
What is the difference between a day trade and a swing trade?
A day trade buys and sells (or short-sells and covers) the same security on the same day in a margin account. A long position held overnight and sold the next day, before any new purchase of the same security, is an exception to that definition. Timeframe follows from the holding time you plan.
Why do the 5-minute and 1-hour charts show different trends?
When the two disagree, treat the higher chart as the direction and the lower chart as timing. Disagreement is a reason to wait for a zone, not a flaw in either chart.
Sources
- SEC Office of Investor Education and Advocacy, Margin Rules for Day Trading, 2021. https://www.investor.gov/introduction-investing/general-resources/news-alerts/alerts-bulle
- Investor.gov (SEC), Thinking About Day Trading? Know the Risks, 2020. https://www.investor.gov/additional-resources/spotlight/formerdirectorlorischock-directors
- Investor.gov (SEC), Pattern Day Trader, 2021. https://www.investor.gov/introduction-investing/investing-basics/glossary/pattern-day-trad
- SEC, SEC approval order for FINRA rule change, Release No. 34-104572, 2026. https://www.sec.gov/files/rules/sro/finra/2026/34-104572.pdf
- Journal of Financial Markets (Barber, Lee, Liu, Odean), The cross-section of speculator skill: Evidence from day trading, 2014. https://econpapers.repec.org/article/eeefinmar/v_3a18_3ay_3a2014_3ai_3ac_3ap_3a1-24.htm
- CME Group, E-mini S&P 500 Product Overview, 2024. https://www.cmegroup.com/education/lessons/product-e-mini-s-and-p
- FCA, Restricting contract for difference products (CP18-38), 2018. https://www.fca.org.uk/publication/consultation/cp18-38.pdf
- ESMA, ESMA35-43-1000 (CFD and binary options product intervention measures), 2018. https://www.consob.it/documents/1912911/1970971/esma35_43_1000.pdf/6dc9bc30-c528-09dc-9430
- IG, pip definition. https://www.ig.com/en/glossary-trading-terms/pip-definition
- IG, Slippage definition. https://www.ig.com/au/glossary-trading-terms/slippage-definition
Want to compare timeframes side by side?
Open one market on two timeframes in a single layout and read both.
Open a chartEducational content, not financial advice. This guide is general education; trading leveraged products can lose more than you expect, so consider your own circumstances.